 Kyoto, Japan -- Otowyama (音羽山) -- Copyright 2015 Jeffrey Friedl, https://regex.info/blog/")
Nikon D700 + Sigma “Bigma” 50-500mm OS @ 50mm — 1/1250 sec, f/8, ISO 560 — map & image data — nearby photos
Top of Mt. Otowa (音羽山)
Kyoto, Japan
I made my second cycling run up Mt. Otowa (音羽山) on Wednesday, the first having been two days prior in the gloomy late afternoon just before a typhoon came through. Wednesday's was the first afternoon after the mild typhoon passed, so I expected the air to be really clear (like this and this), so I lugged my Sigma “Bigma” 50mm~500mm zoom all the way up there, along with the 2×TC to give me a 1,000mm lens.
It was so not worth it... it was the most hazy I'd seen it in ages.
 -- Kyoto, Japan -- Copyright 2015 Jeffrey Friedl, https://regex.info/blog/")
Nikon D700 + Sigma “Bigma” 50-500mm OS @ 100mm — 1/1250 sec, f/13, ISO 800 — map & image data — nearby photos
Super Super Hazy
I was there for an hour, and could never even find Kyoto Tower
The only things that were sort of clearly visible were close, just near the foot of the mountain. This is a gas station that I pass by along the way that marks an increase in the steepness of the route...
 -- Kyoto, Japan -- Copyright 2015 Jeffrey Friedl, https://regex.info/blog/")
Nikon D700 + Sigma “Bigma” 50-500mm OS @ 1000mm — 1/1250 sec, f/13, ISO 1800 — map & image data — nearby photos
Starts to Get Steeper Soon
As the crow flies it's about 2,580m (1.6mi) away, but due to how the road winds up the mountain, the covered distance is about three times that. It took me about 49 minutes to make it from there, and about 23 minutes to make it back down.
(If find it shocking that the return trip takes only half the time; it feels like it takes about 1/10th the time.)
In the spirit of “The Voodoo of Elevation Gain and Strava (and How I Get Around It)”, I brought three GPS/GLONASS units with me, using various ways to extract nine different tracklogs...
| Device | Tracklogs |
|---|---|
| Apple iPhone 6+ |
Via the Strava app.
Via Abvio's Runmeter app. Via the Runtastic app. Via the |
| Garmin eTrex 20 | downloaded from the device |
| Bad Elf GPS Pro + |
Downloaded via their app, with GPS elevation.
Downloaded via USB, with GPS elevation. Downloaded via their app, with barometric elevation. Downloaded via USB, with barometric elevation. |
Now in theory, all four iPhone apps should produce the same tracklog because they all share the same iOS Location Services data, but they're all quite different. Runmeter (which is identical to their Cyclemeter and Walkmeter apps except for the name and icon) has an option to use the iPhone's barometric altimeter, and as the Voodoo post explains, the Strava app ignores both iPhone altimeters, but elevation aside, the latitude/longitude tracks among the four should be identical, but they're far from it:
The Four “Identical” iPhone-app Tracks
Part (all?) of the problem is the sampling frequency. Of the four iPhone apps, the most frequent logger is Guru Maps, which creates a datapoint every second when there's obvious movement. The other three apps sample the location “every so often” in ways that can lead to some big errors. For example, Runmeter's didn't put a datapoint for where I stopped my ride until more than 30 seconds after I had stopped, making it look as if I was 30+ seconds slower than I actually was. Adding 30+ seconds to a segment can destroy the effort (e.g. a hill-sprint that takes a respectable 90 seconds gets recorded as a pathetic two minutes.)
Even more odd are the four tracklogs from the Bad Elf GPS Pro+. On the plus side, it records a data point once every second (and can be configured to record 10 per second!), and also, it records altitude two ways (satellite and barometric). Because of that last feature, in extracting its data, I'd expect one track with two elevation profiles, but as odd as it seems, one can actually derive two different tracks with four elevation profiles. You see, tracklogs can be pulled from the device via direct USB connection, or via its iOS app. One would think that either method is just transporting the same data, but they inexplicably give different data. I then split each into two tracklogs, one with the satellite altitude, and one with the barometric altitude. So we end up with two tracks with four different elevation profiles. Bizarre.
(I so wanted to like this unit, mostly because the company seemed to have a clue and wasn't Garmin, but with so many little problems like this cropping up, I have to finally admit that I can't recommend the unit.🙁)
Anyway, I have nine tracklogs, and of course none of them agree on the amount of vertical gain. This problem likely stems from the aforementioned sampling frequency, and also the data source (barometric or satellite altimeter) and post processing. Here's a look at the tracklogs, their resulting plot in Google Earth, and various claims about the vertical climb: what the app itself claimed, what my software calculates, and what Google Earth calculates...
| Vertical Gain (meters) | ||||
|---|---|---|---|---|
| Tracklog | Points | App | Jeff | Earth |
| iPhone / Guru | 5,243 | 738 | 814 | |
| iPhone / Strava | 3,979 | 984 | 1087 | 1194 |
| iPhone / Runmeter | 658 | 607 | 582 | 635 |
| iPhone / Runtastic | 2,242 | 879 | 863 | 932 |
| Bad Elf (app/GPS) | 9,641 | 782 | 855 | |
| Bad Elf (app/baro) | 9,641 | 620 | 752 | |
| Bad Elf (USB/GPS) | 9,641 | 782 | 823 | |
| Bad Elf (USB/baro) | 9,641 | 623 | 760 | |
| Garmin eTrex 20 | 9635 | 931 | 1001 | |
The wide variation among results is pretty ridiculous, which is probably an accurate reflection on the state of consumer GPS, and perhaps why Strava throws away your elevation data in preference for its data. Sure, Strava's data may be wildly incorrect, but at least it's consistently incorrect (well, it has consistency to the extent that a user's two-dimensional location data — latitude and longitude of each point along the route — is correct, which is to say that it's not really consistent at all. 🙁)
For what it's worth, the shape of the “iPhone / Guru” elevation profile looks the most realistic, followed closely by Runmeter and the Bad Elf barometric. The Runtastic and Strava results are just ridiculous, and the GPS tracks from the Bad Elf and Garmin units are clearly broken.
It's a sad state of affairs. I'd love to try the test with one of those $10,000 commercial/professional unit.
So what's the actual vertical climb for this route?
I'm going to say it's 700m (2,300').
The government of Japan makes very accurate laser-derived elevation data available on this web site. The route from my house up to the top of the mountain can be broken into just a few up/down segments, whose vertical climb can be easily derived by comparing the elevation at the start and end:
- Front door to Sanjo St: down 2m
- To top of Keage hill: up 51.8m
- To low spot just before turnoff to old Sanjo: down 46.5m
- To the gas station seen above: up 35.9m
- Underpass below Rt 1: down 4.8m
- To high point at trail entrance at end of road: up 423m
- Tiny/steep downslope near start of trail: down 7m
- To top of mountain: up 110.5
The “ups” are the vertical climb on the way there, and the “downs” become climbs on the way back, so just adding them all together gives the total: 681.5m
This is an absolute lower bound... the vertical climb will be more if there were rising slopes that I forgot about.
I do know that there were a few spots on the steep road up the mountain where it leveled off for a while, and even went slightly downhill for some time (short reprieves certainly appreciated). I couldn't measure these well on the web site because I didn't remember their exact locations, but let's say there were four of them and the elevation loss was just 2m each, then that adds 8m (4×2m) that we have to re-climb on the way up, and the same for the way down, so that leaves us with a calculated 697.5m. It's probably a bit more than that due to fluctuations on what seem flat sections, so let's round it up to 700m and call it a day.
In the end, I uploaded a smoothed version of the Guru track to Strava, where it appears as “Otowayama #2 (音羽山その二)” with a vertical climb pulled out of thin air as 771m.
 -- Kyoto , Kyoto, Japan -- Copyright 2015 Jeffrey Friedl, https://regex.info/blog/")
Nikon D4 + Nikkor 14-24mm f/2.8 @ 14mm — 1/500 sec, f/4, ISO 250 — map & image data — nearby photos
“Environmental Portrait”
Matt Campagna at the Fushimi Inari Shrine, Kyoto Japan
It's been three weeks since I posted “Matt Campagna Wigglegrams Kyoto”, so I'm finally getting around now to posting other photos from that outing, where I met fellow Lightroom developer Matt Campagna while he was visiting Kyoto.
Our plan was to visit the Fushimi Inari Shrine, and since I'd been there for photoshoots many times (most recently with former Yahoo! co-worker Andrei Zmievski, and The Japan Times columnist Alice Gordenker), I thought I'd try something different this time.
Unless I'm going out on a bike ride or other special situation like a heavy snowfall, I tend to bring three lenses, all primes: a 24mm wide-angle, a 50mm or 85mm medium angle, and my favorite lens, the Voigtländer 125mm. But for this outing with Matt, I thought I'd give a super-wide-angle lens a try, so I brought a 14-24mm zoom (along with the 85mm f/1.4 for portraits).
 -- Fushimi-Inari Taisha Shrine (伏見稲荷大社) -- Kyoto , Kyoto, Japan -- Copyright 2015 Jeffrey Friedl, https://regex.info/blog/")
Nikon D4 + Nikkor 14-24mm f/2.8 @ 14mm — 1/500 sec, f/18, ISO 400 — map & image data — nearby photos
Main Entrance
Fushimi-Inari Taisha Shrine (伏見稲荷大社)
 -- Kyoto , Kyoto, Japan -- Copyright 2015 Jeffrey Friedl, https://regex.info/blog/")
Nikon D4 + Nikkor 14-24mm f/2.8 @ 14mm — 1/500 sec, f/16, ISO 450 — map & image data — nearby photos
Matt
a bit apprehensive moments after we met for the first time
 -- Kyoto , Kyoto, Japan -- Copyright 2015 Jeffrey Friedl, https://regex.info/blog/")
Nikon D4 + Nikkor 14-24mm f/2.8 @ 14mm — 1/500 sec, f/18, ISO 220 — map & image data — nearby photos
Unsettling
Part of the goal in bringing the wide-angle lens was to force me to use it, to experiment. One expects some distortion with a wide-angle lens, but when taken out of context by an uncentered crop like the shot above, the result can be a “off” in an unsettling way.
For reference, here's the unedited/uncropped version of the shot above.
 -- Kyoto , Kyoto, Japan -- Copyright 2015 Jeffrey Friedl, https://regex.info/blog/")
Nikon D4 + Nikkor 14-24mm f/2.8 @ 14mm — 1/500 sec, f/18, ISO 220 — map & image data — nearby photos
original unedited/uncropped version
 -- Kyoto , Kyoto, Japan -- Copyright 2015 Jeffrey Friedl, https://regex.info/blog/")
Nikon D4 + Nikkor 14-24mm f/2.8 @ 14mm — 1/500 sec, f/18, ISO 2000 — map & image data — nearby photos
Less Unsettling
This shot clearly has distortion, but it's not unsettling to me, I suppose, because the crop is more centered...
 -- Kyoto , Kyoto, Japan -- Copyright 2015 Jeffrey Friedl, https://regex.info/blog/")
Nikon D4 + Nikkor 14-24mm f/2.8 @ 14mm — 1/500 sec, f/18, ISO 2000 — map & image data — nearby photos
original unedited/uncropped version
 -- Kyoto , Kyoto, Japan -- Copyright 2015 Jeffrey Friedl, https://regex.info/blog/")
Nikon D4 + Nikkor 14-24mm f/2.8 @ 14mm — 1/1000 sec, f/3.5, ISO 100 — map & image data — nearby photos
That's a Mighty Big Camera You've Got There...
Matt's smile is what grabs and holds the attention in this shot, but once you notice how big the camera has become, it's hard to unnotice. He's holding a Nikon D4, the same as I'm using.

Nikon D4 + Nikkor 85mm f/1.4 — 1/400 sec, f/1.4, ISO 6400 — map & image data — nearby photos
Green Tea
and green face
We stopped at a cafe for a cool drink, and with a lot of leaves just outside the big windows next to us (as seen in this shot of the same table), there was a green cast over Matt's face. The green is all natural, coming from all the foliage outside and all, but ever since this experience with low-quality lights I've been sensitive to a green color cast, and want to remove it.
I took a closer portrait shot, and in Lightroom tried to reduce the level of green...

Nikon D4 + Nikkor 85mm f/1.4 — 1/500 sec, f/1.4, ISO 2200 — map & image data — nearby photos
Less Green

Nikon D4 + Nikkor 85mm f/1.4 — 1/500 sec, f/1.4, ISO 4000 — map & image data — nearby photos
More Grin
 -- Kyoto , Kyoto, Japan -- Copyright 2015 Jeffrey Friedl, https://regex.info/blog/")
Nikon D4 + Nikkor 14-24mm f/2.8 @ 14mm — 1/500 sec, f/2.8, ISO 640 — map & image data — nearby photos
Another “Environmental”
perhaps this is what a super-wide-angle is best for
 -- Kyoto , Kyoto, Japan -- Copyright 2015 Jeffrey Friedl, https://regex.info/blog/")
Nikon D4 + Nikkor 14-24mm f/2.8 @ 14mm — 1/500 sec, f/2.8, ISO 1250 — map & image data — nearby photos
Completely Lost
The “lost” in the caption refers not to directions around the sprawling shrine complex, but to the amazing sense of hidden wonder and escape that this specific location had... that sense is lost in the photo, which has little to recommend it beyond the journalistic statement that Matt was at that location.
I'll have to put some thought in how to capture that sense.
 -- Kyoto , Kyoto, Japan -- Copyright 2015 Jeffrey Friedl, https://regex.info/blog/")
Nikon D4 + Nikkor 14-24mm f/2.8 @ 14mm — 1/500 sec, f/4, ISO 3200 — map & image data — nearby photos
Farther Inside
precariously close to the splashing stream of water
I'm not a big fan of wide-angle lenses, probably because I don't have an innate sense on how to use it well, nor enough practical experience to overcome the lack of instinct. Still, in the seven years I've had it, I've posted 140 photos with it at its most wide angle (14mm), and have added 11 more today. I seem to like it best for the “environmental” shots, showing the subject in the wider context of the surrounding environment.
Here are links to a few random 14mm shots posted over the years: here, here, here, here, here, here, here, here, here, here, and here.
, Kyoto Japan -- Otowyama (音羽山) -- Copyright 2015 Jeffrey Friedl, https://regex.info/blog/ -- This photo is licensed to the public under the Creative Commons Attribution-NonCommercial 4.0 International License http://creativecommons.org/licenses/by-nc/4.0/ (non-commercial use is freely allowed if proper attribution is given, including a link back to this page on http://regex.info/ when used online)")
Nikon D4 + Sigma “Bigma” 50-500mm OS @ 50mm — 1/200 sec, f/4.5, ISO 2500 — map & image data — nearby photos
Not Much of a Sunset
Mt. Otowyama (音羽山), Kyoto Japan
I've found a new place to try to get nice sunset photos of Kyoto from. Sort of.
For years my go-to place has been the Shogunzuka, which I first posted about almost eight years ago, but have posted about many times since. It's a 5-minute drive from my place on a high hill (small mountain?) over eastern Kyoto.
The small mountain it's on is the little bump going across the center of the shot above... the mountain I'm on for the shot, Mt. Otowayama, is 593m (1,950') high and 6½ km farther away. It took me about an hour fifteen minutes to ride my bike there this evening. I went in hopes of a nice sunset, but there were only gray skies in anticipation for a typhoon passing by in a day or two.
Maybe next time.
[Update: unfortunately not]
 -- Kyoto, Japan -- Copyright 2015 Jeffrey Friedl, https://regex.info/blog/ -- This photo is licensed to the public under the Creative Commons Attribution-NonCommercial 4.0 International License http://creativecommons.org/licenses/by-nc/4.0/ (non-commercial use is freely allowed if proper attribution is given, including a link back to this page on http://regex.info/ when used online)")
Nikon D4 + Sigma “Bigma” 50-500mm OS @ 50mm — 1/200 sec, f/4.5, ISO 2800 — map & image data — nearby photos
My Ride
I'd not known about the place until yesterday when a friend posted a photo from the top on Facebook. So today I gave it a try.
One really needs a mountain bike to get there. A closed mostly-paved road gets you close, but the last little bit is a mountain trail. I had to push the bike on a few sections of extremely steep trail, but otherwise could ride most of the way.
I was gratified to break my record on a few of the smaller hills on the way there and back. Getting the “PR” (personal record) on a ride is sort of addictive, but also a diminishing resource. I made one today by just one second, so further records will actually require some effort on my part....
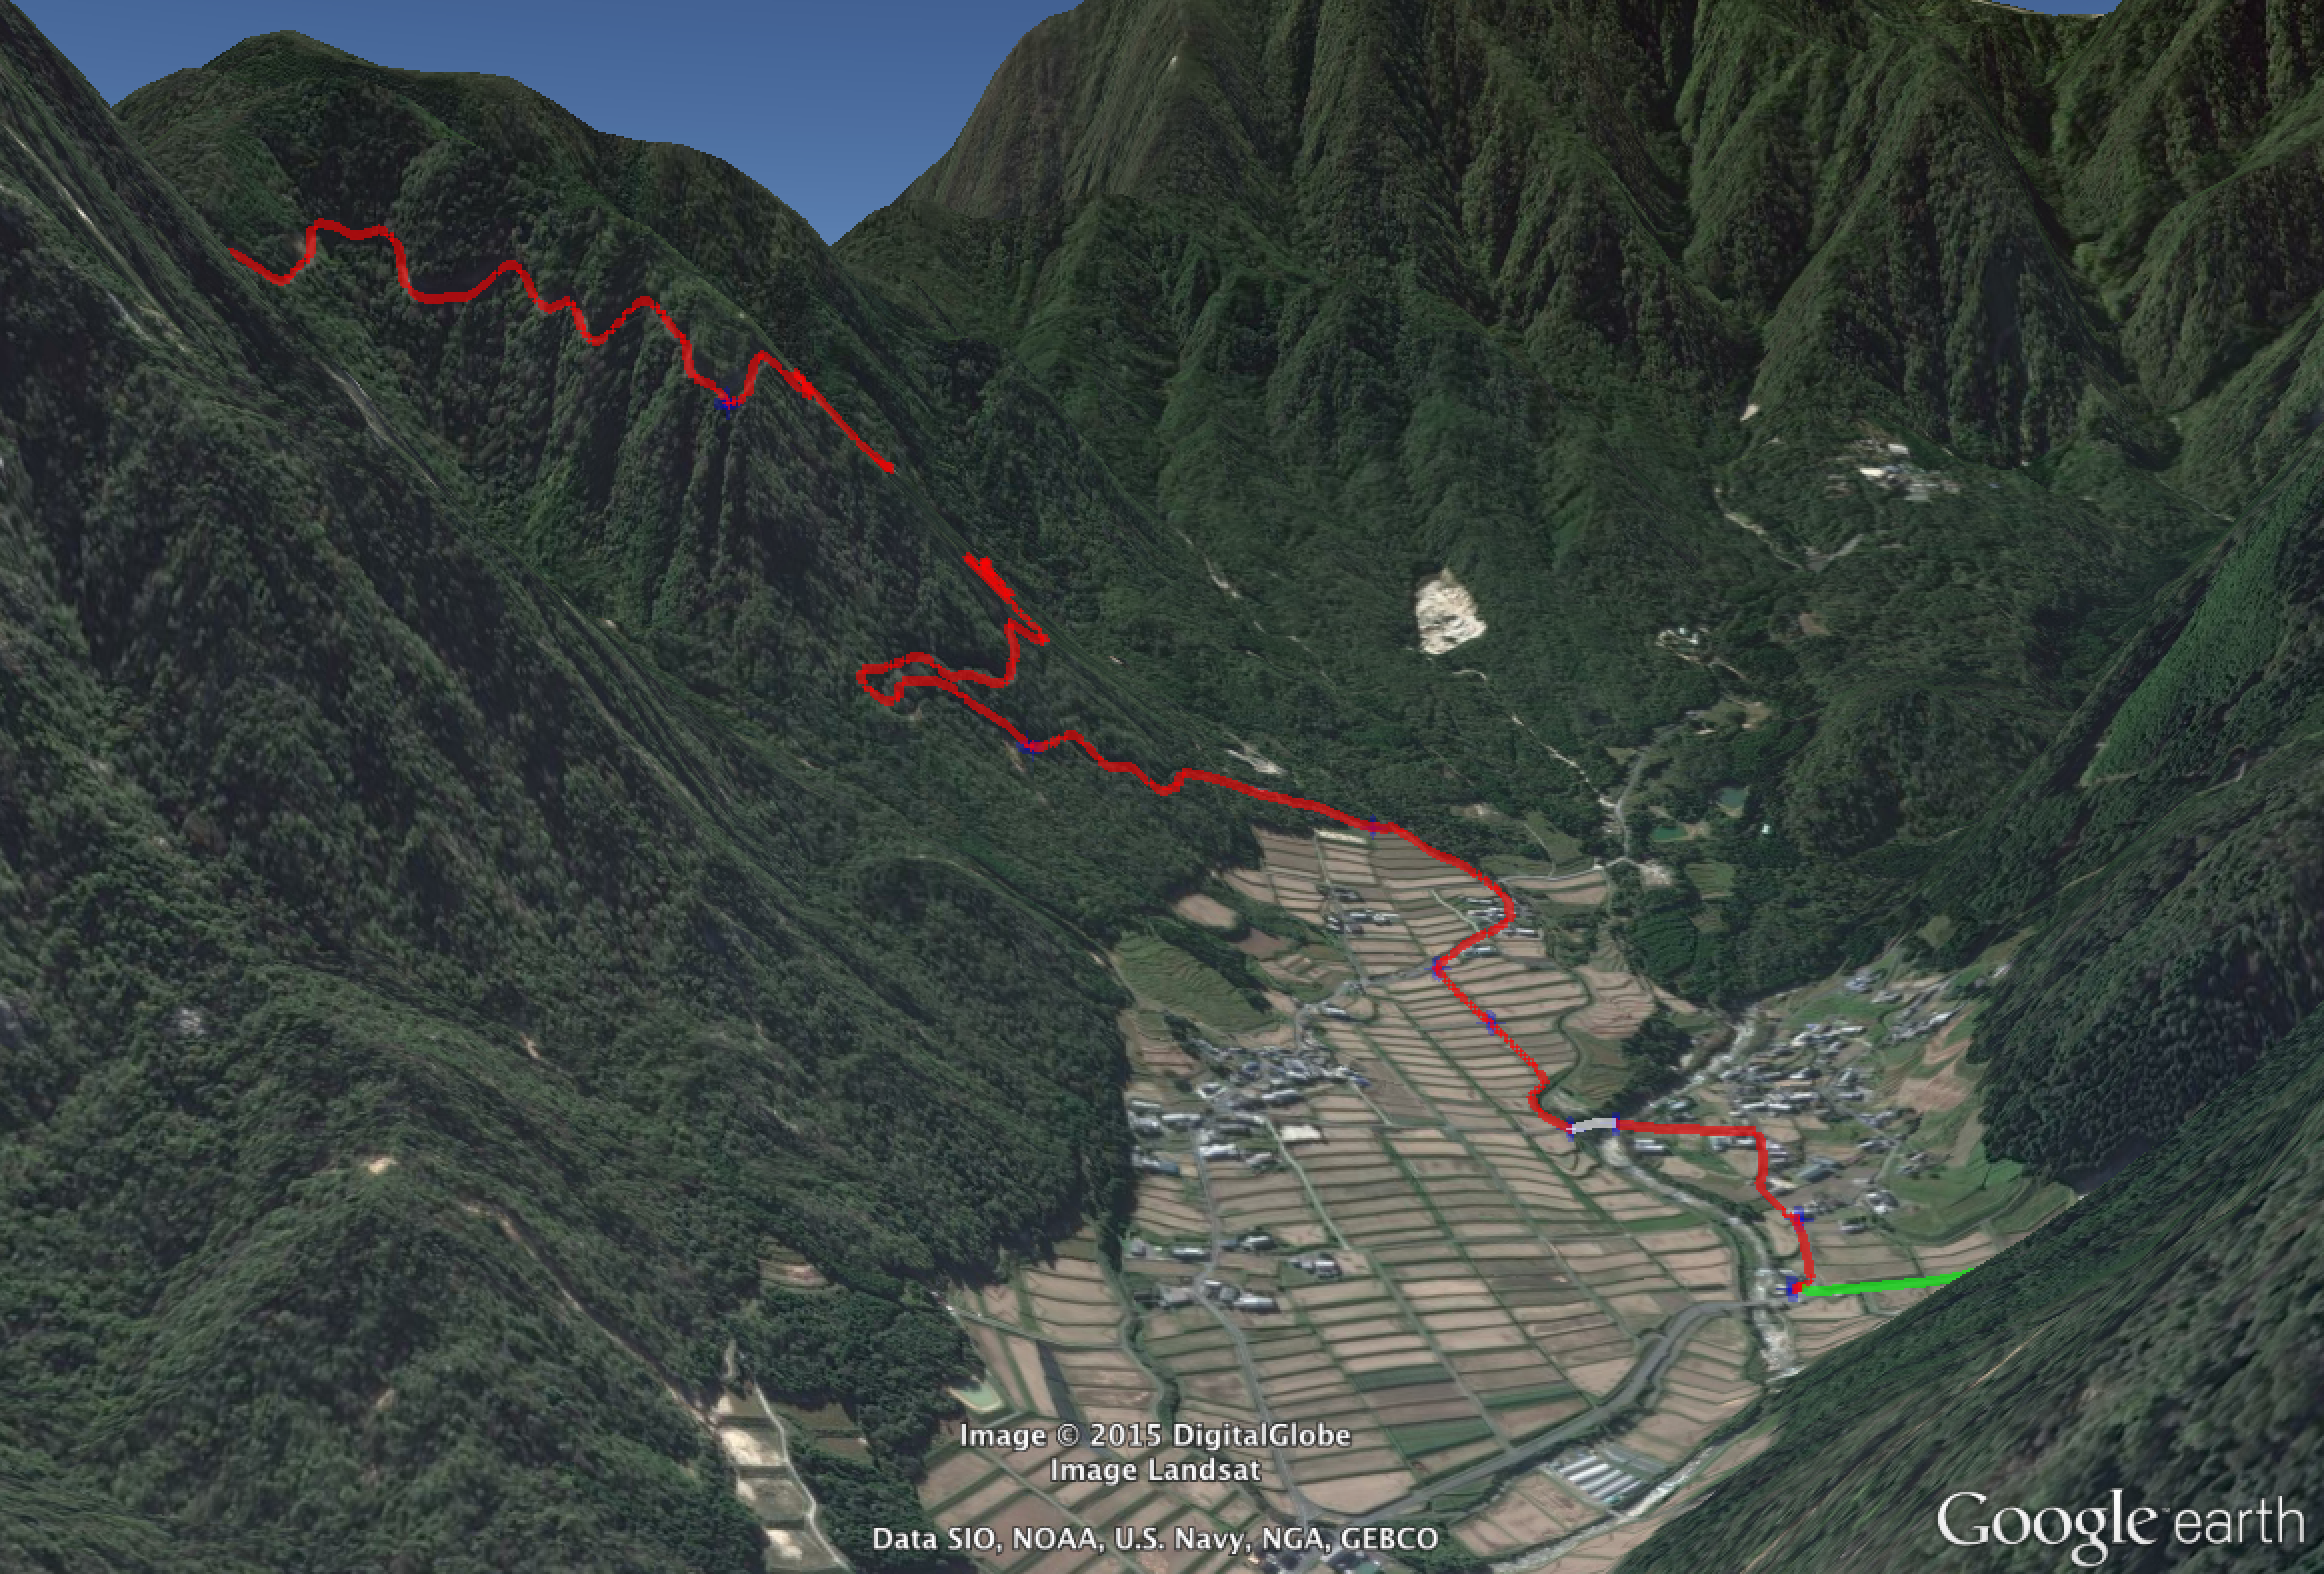
A Light Mountain Climb After Lunch
340m climb from the village of Kurodani, Takashima City, Shiga Japan
高島市黒谷からの山登り
In the screenshot of Google Earth above, you can see the route that I rode my bicycle last Wednesday... the little bit of green coming in from the right is a downhill section of road, followed by the long red uphill section through the tiered rice paddies of the village, then up the mountain on an old road no longer open to traffic.
I'd ridden 55km (34mi) to get to that point, and would end up riding 72km (44mi) farther before I got home, but ever since my first “real” ride in February, I've not been so interested in how much distance I've covered, but rather, in how much mountain I've conquered. This means the important statistic for me is how much “vertical climb” or “elevation gain” I did during a ride, the sum of all the rises/climbs/ascents on the route.
And it's not just me... vertical climb is often used as a badge of achievement for a ride, and seems to get more talk than distance. It's a strong reflection for how tough a route is.
The problem is that it's difficult to figure out the vertical climb for a particular route, and commonly-used methods are often wildly inaccurate.
Cyclers I've met record the ride with a GPS unit of some sort (their iPhone, a bike computer, a runner's watch, etc.) and upload the data to Strava, a service that allows you to analyze your activity and share info about it with others. It's very popular and mostly very well done.
For example, I mentioned it in my previous post about a long mountain bikeride that I did on April 30th, where Strava had informed me that I had beaten my record for a particularly tough mountain climb:

Data About My Rides
Courtesy of Strava.com
Footnote: I've since beat it again, but by only 10 seconds.
When you upload your data to Strava, they calculate your vertical climb for the activity, and display it prominently. For example, the aforementioned first real mountain ride shows some impressive stats:

Since it was my first real ride, I didn't know any better but to be impressed by the 3.3 kilometers (2 miles!) of vertical climb that I'd done. I was amazing. I was Superman.
Unfortunately, it's all a lie.
Over the course of several big mountain rides, I'd started to feel that the numbers reported on Strava were quite a bit inflated, but I couldn't put my finger on exactly how.
A week or so ago I posed about another ride, “Short but Intense Bike Ride in Northern Kyoto”, where someone commented about the apparent discrepancy between reality and what Strava reported (and hence what I claimed). This spurred me into investigating, and I've spent the last week digging in, writing tracklog-analysis software, doing tests, etc.
So, when I went out on a long ride last Wednesday, I brought an arsenal of equipment with me, recording five separate logs with three different GPS/GLONASS-equipped devices.
The trip ended up being my longest ride ever, about 125km (78mi), and also had the most vertical climb I'd ever done in one day. Among the many ways I recorded the trip's data, I used Strava's mobile app on my iPhone 6+, and when I was done I had the app upload all the data to Strava.
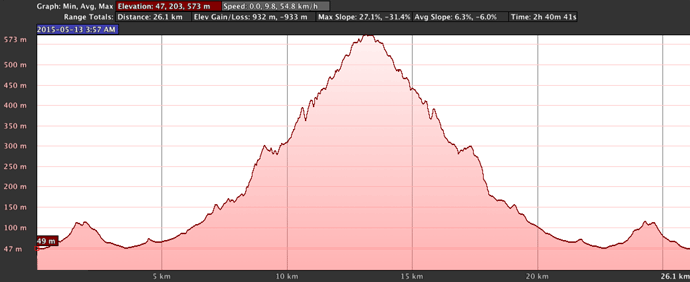
Here's what Strava reported about that trip:

Impressive!
but wrong
The elevation graph at the bottom is an accurate representation of the 11-hour ride, with four separate major mountain peaks transversed, along with many little ones (though they each didn't seem little at the time!).
Strava informs me that the trip encompassed an impressive 3,627m (11,900') of vertical climb. It looks like I started at about 50m and initially climbed to about 500m, and from there went down and up quite a bit — and believe me, I did — but looking at the graph it's difficult to come up with a 3,637m sum for all the “up” parts.
In reality, I believe the vertical climb on the trip was about 2,225m (7,300').
First, let's look at why Strava's numbers are so wrong, then let's look at how to get a better answer.
There are various ways a unit can record your elevation as you travel, and all of them are generally untrustworthy. Modern units like an iPhone or a dedicated unit like a Bad Elf GPS Pro+ have three methods to figure altitude: GPS, GLONASS, and a barometric altimeter.
GPS/GLONASS can be fairly accurate with your latitude and longitude, as I've discussed in prior posts, such as “Informal GPS Logger Test: iPhone 4s GPS is Shockingly Good” and “Another Informal Location-Logger Test”. It's fantastically-amazing technology that is perhaps the only time we come in contact with something that must actually take into account Einstein's general theory of relativity. But it's not perfect, and of the three dimensions, elevation is by far the least accurate.
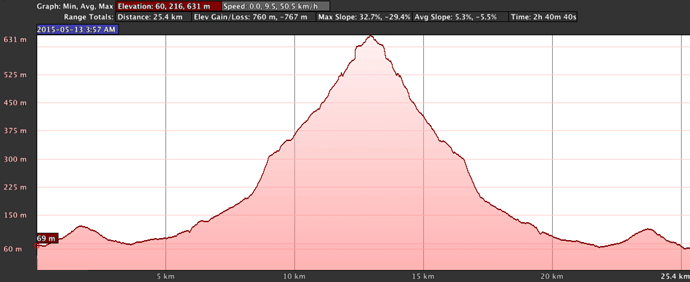
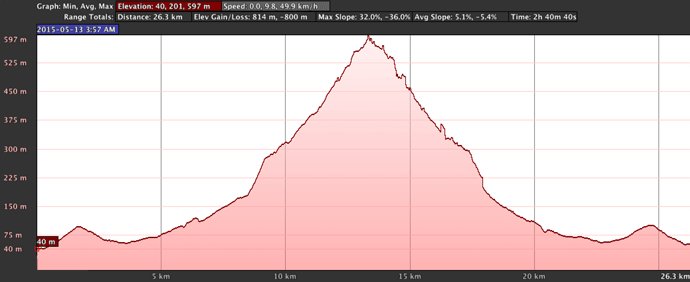
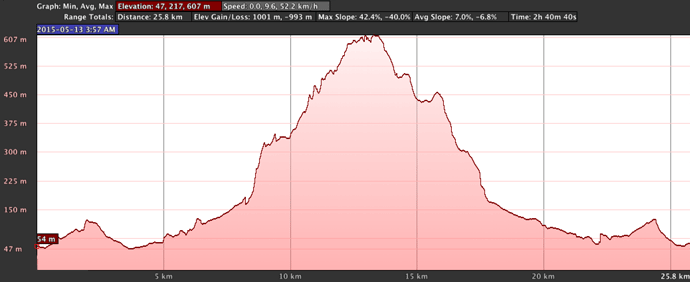
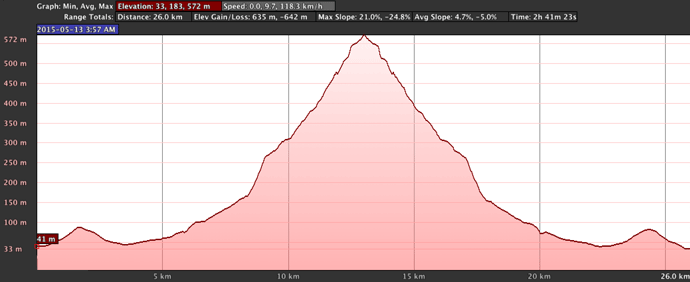
Consider these views of three GPS/GLONASS units' tracklogs plotted in Google Earth, of various sections of last Wednesday's ride:


The three units rarely agreed with each other on the elevation, nor any of them with Google data as seen in Google Earth, and they each in their own way tended to wander off wildly at times. (The tracks, when viewed directly from above, all matched up with each other and the road quite well... it's only the elevation data that was, so to speak, all over the map.)
When wishing to track vertical climb, the absolute accuracy of a unit is not particularly important, it's the relative accuracy and stability that are important, and it seems that barometric altimeters provide better results.
My first experience with a barometric altimeter, on a Garmin GPS unit a decade ago, was very bad. If there was a breeze or you walked with the unit, it would record a non-trivial change in elevation (up or down, depending on how the unit was physically angled relative to the air movement). It was ridiculous.
Things seem better now. On last Wednesday's trip, I had two barometric altimeters with me, the one in my iPhone 6+, and another on a Bad Elf GPS+. Here's their plots for the last section seen above:

Anyway, a naïve calculation of vertical climb looks at each data point and, if the elevation of a point is higher than the previous point, add the difference to the total. Minor errors that result in small fluctuations over the short term result in wildly-inflated overall results, but one can smooth the raw data (e.g. with a moving average) to get more realistic results. That's apparently what Google Earth does, so let's look at what it calculates for each of my five tracklogs:
| Unit | Type | Google-Earth Vertical-Climb Calculation | |
|---|---|---|---|
| BadElf GPS+ | GPS/GLONASS | 3,479m | 11,414' |
| BadElf GPS+ | Barometric | 2,174m | 7,133' |
| Garmin eTrex 20 | GPS/GLONASS | 3,265m | 10,712' |
| Apple iPhone 6+ | GPS/GLONASS | 2,215m | 7,267' |
| Apple iPhone 6+ | Barometric | 2,009m | 6,591' |
That's quite a range of results from the very same trip. Which is correct? Frankly, probably none of them.
As we'll see later, there are techniques we can use to eke out some fairly reasonable results, but first let's see what Strava actually does...
What Strava Does
Strava's iPhone app has access to both iPhone altimeters (barometric and GPS/GLONASS), but in the end it uses neither. Rather, it throws away that elevation data and instead relies on its own database of elevation data (likely the same data that Google uses to show 3D elevation in Google Earth).
Strava's approach may well be fine in generally-flat areas, but it produces ridiculously-overinflated results in the mountainous areas I've checked, and it's easy to see why...
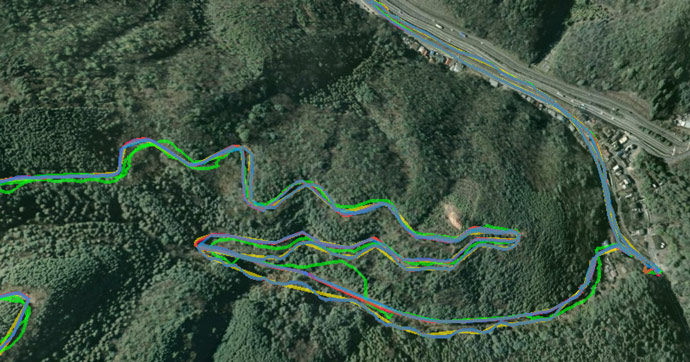
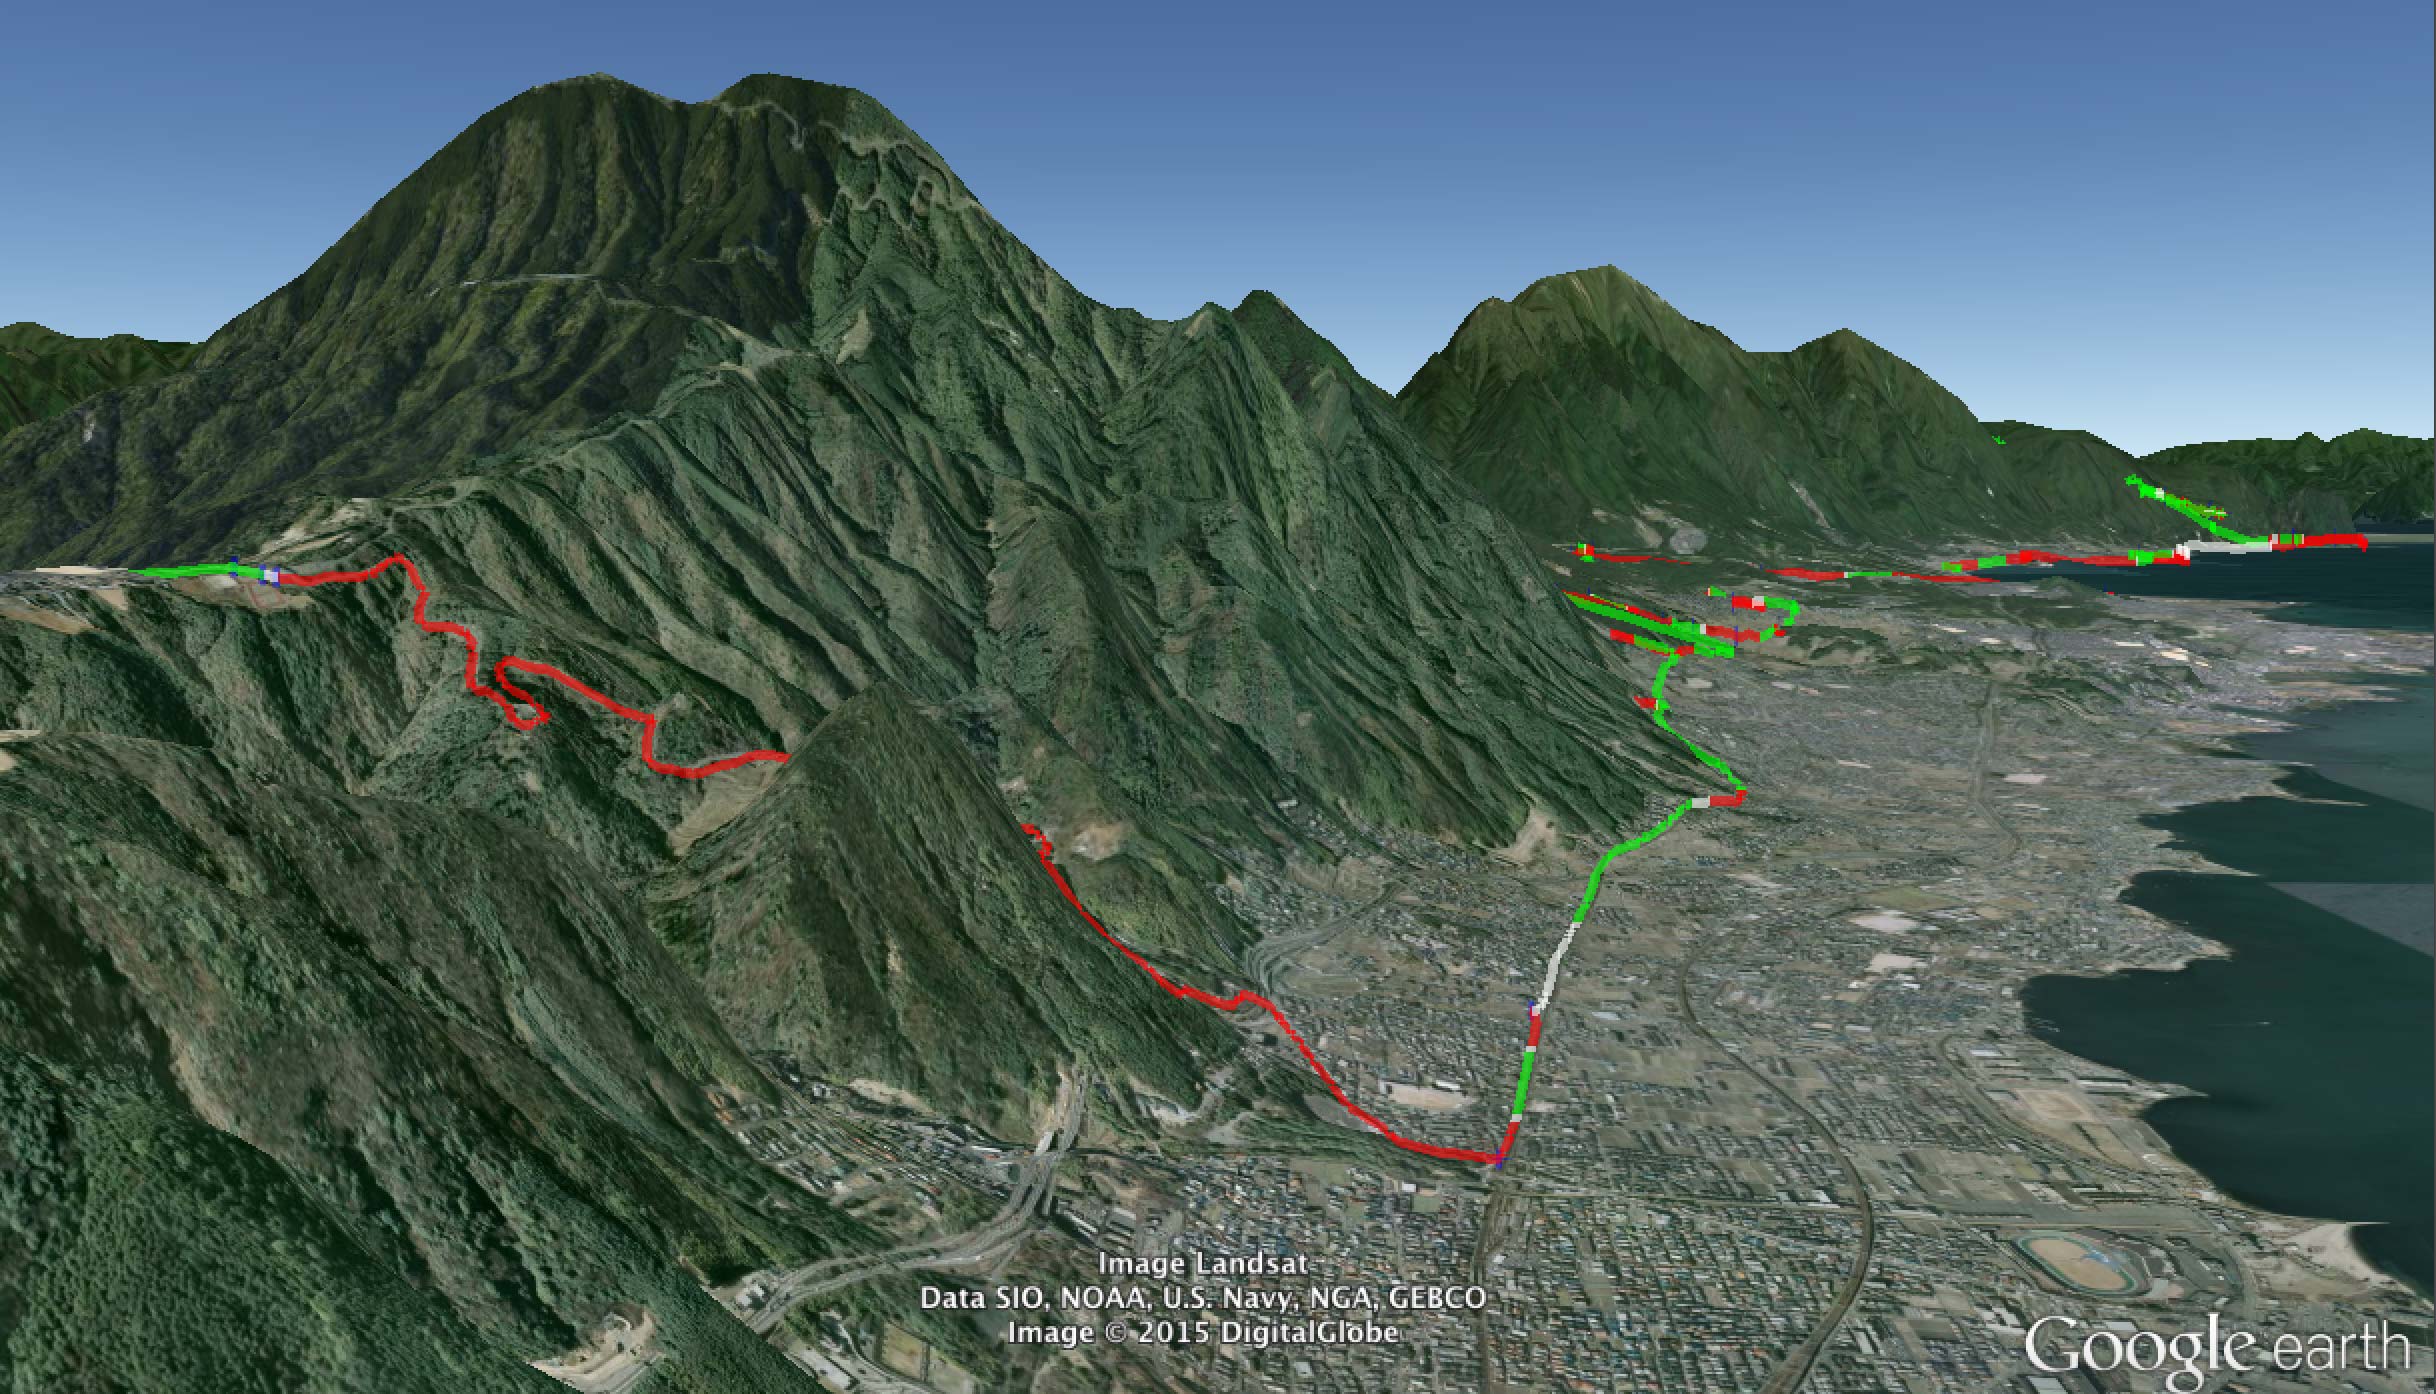
I created some software to analyze the tracklogs, smooth local irregularities, and present uphill sections in red and downhill sections in green. Let's look at the mountain shown in this article's lead photo, a long climb followed by a long, enjoyable descent down the other side...

Reality
red means uphill, green means downhill
Both the climb and the descent were quite straightfoward; the climb was a solid climb without any downhill breaks, and the descent was a solid descent without any uphill sections. That's why the ascent is a solid red line above, and the descent is a solid green line.
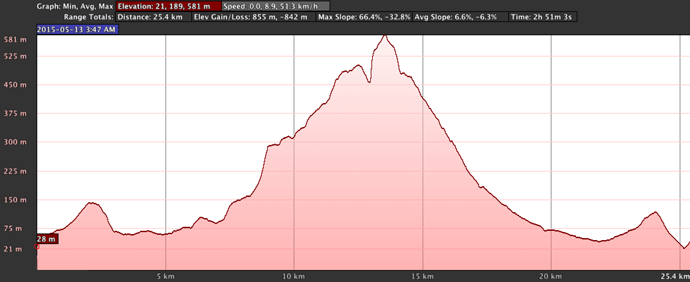
Now, let's look at how Strava sees it, as well as all my data sources...

from Strava's elevation data
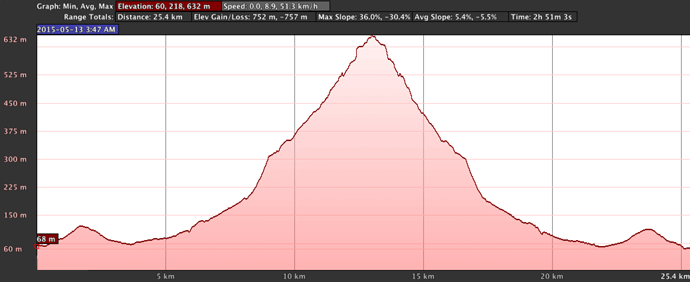
Bad Elf GPS+ (using its barometric altimeter)
")
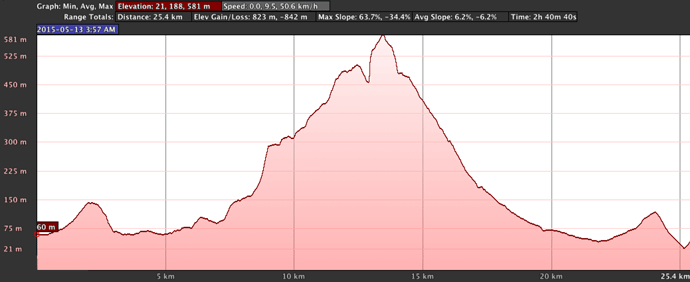
Bad Elf GPS+ (using GPS/GLONASS)

iPhone 6+ using GPS/GLONASS, as recorded with
")
Garmin eTrex 20 (GPS/GLONASS)

mouseover a button to see that image
The Strava data shows many ups and downs on both sides of the mountain... ups and downs that simply weren't there. It's easy to see why when you look at the mountain in Google Earth (which I believe uses the same elevation data) from the side. Here's the side of the mountain that I rode down:

very-3D mountain pressed into a mostly-2D face
The road appears undulate up and down as it makes overall progresses lower, and to Strava, the “ups” count as vertical climb:

Strava “detects” many false climbs (216m/700' just in this view alone)
Of course, the road doesn't undulate up and down (it progresses “monotonically” down), but it does undulate side to side around ravines cut into the side of the mountain by eons of water and wind. You can sort of see the proper undulation in this path created with a barometric altimeter:

descending around ravines that do exist, but which aren't presented in Google Earth
I should be clear that I'm not complaining about Google... the resources they've freely gifted to the world in Google Earth and Google Maps continues to amaze me, and I'm extremely thankful for them.
I'm not quite sure that I'm complaining about Strava. Perhaps these easily-avoidable inflated results are particular to my area of Japan, and the rest of the world enjoys added accuracy due to Strava's policies. I don't know. But I do know that a lot of folks around the world complain about Strava's inflated elevation claims, so at least I know that I'm not alone.
So How Can We Do Better
First of all, I should note that Strava does respect the recorded elevation in some situations where it recognizes that the data was recorded with a barometric altimeter. Their own iPhone app, however, either doesn't use the barometric altimeter or doesn't notice that it does, so users get stuck with Strava's wild elevation data.
Where Strava does accept a device's elevation data, they offer the user a way to get “corrected” data, whereby Strava throws away the user's data and replaces it with their inaccurate elevation-database data. This results in a much less accurate result for many folks, but they offer no way to undo this action, so if you bump the link by accident, you're hosed.
They also don't allow you to toggle between your device elevation data (barometric or not) and their data. It seems that they really want to push their data, and who can blame them? Folks like me early on, ignorant of the hyper-inflated vertical-climb data, get an ego boost from seeing the big numbers. I suppose boosted egos help their business interests.
(I'm thankful for their service, which I have enjoyed without cost. I just wish this aspect were better.)
(Update: Strava has a lot of problems as a company in how they respect their users, but in the end I appreciate the tools that do seem to work, so I've signed up as a paying customer.)
Luckily, one crack in their anti-reality armor is that they allow geeky types like me to create tracklogs with other devices, then modify the tracklog to force Strava to accept the elevation data as is, and upload that.
Massaging Tracklog Data
I've spent the last few days writing software to analyze tracklog data, to smooth it out, and to derive meaningful information from it.
The first step is to identify when you're stopped, because if you're not moving, you should have no elevation gain or loss, no speed... nothing. You're stopped.
Unfortunately, GPS receivers tend to record drifting locations when stationary, such as the hour I spent visiting someone (this sweet lady) in the mountains along the way on Wednesday's long ride:

this is what an hour's complete lack of movement looks like
My analysis figured out that all that movement didn't really get me anywhere, so it filters it out and marks the stopped location with a little blue ring:

“pause” detected
I have my software note the length of the pause in the KML label, like this:

My pause detection seems to be highly accurate, and I compared its results with the reality that I remembered on the trip, and it's pretty much perfect. It even accurately detected a 10-second pause at an intersection waiting for a few cars to clear before I crossed over:

10-second pause for traffic

45-minute pause wandering in and around a convenience store
while waiting for a friend to join me on the trip
Then my software goes through the entire trip to find the highest peak and the lowest valley, and pin the elevation at those locations. That divides the whole trip into four parts, each of which is subject to the same analysis, and this analysis recurses (repeats onto itself) over and over until the difference between a local peak and a local valley is almost within the range of noise.
Once all these local peaks and valleys are found, the elevation of all the points in between are smoothed using a moving average. The elevation of each peak/valley point is left undisturbed, and it's the elevation rise between them that adds up to the trip's vertical climb.
After all this analysis, the software prepares a KML file that shows the trip, with red lines for climbs, green for descents, and white for flat sections (and, optionally, the blue circles for pauses). Here's one view of the second half of my trip:
Looking North up the eastern side of Lake Biwa
The red line at the far right ends at the Shirahige Shrine (seen here in the report on a ride two weeks ago), which we visited briefly after having come over the mountain, before turning south to ride home.
The distance from the shrine in the background to the spot in the foreground where the route turns 90 degrees and pitches up into the mountains is 30km (18mi) as the crow flies, which I mention for scale.
Here's the whole 125km (78mi) trip:

If you'd like to see it yourself, you can download the KML file (with pauses / without pauses) to view in Google Earth.
The “with pauses” view is best for me when I want to “relive the experience”, and I can see, for example, that I stopped for half an hour — 31:26 — to eat lunch (at this place that I last visited seven years ago), and then progressed up the mountain stopping at intervals for photos, to check directions, or to fix a popped chain.

That view is pretty cluttered if all I want to do is analyze whether the vertical-climb data seems reasonable, so for that the “without pauses” version is better:

The duration includes all the intervening pauses, rendering it fairly meaningless, so I should probably simply remove it, but at the moment it's still there.
Anyway, I did this analysis on all my tracklogs, and found that the one produced by the Bad Elf GPS+ with barometric altimeter seemed to most match reality, so that's the one I consider, relatively speaking, “correct”.
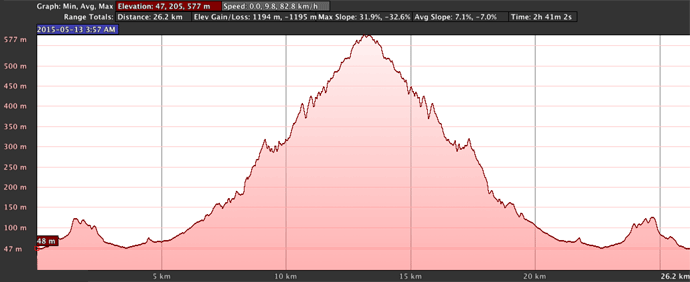
And after all this analysis and cleaning and smoothing, I'm left with a tracklog that I (relatively speaking) trust, so I prepare it so that Strava won't override the elevation data, and upload it. Strava doesn't know that I've grooomed it, so it does its standard processing, and comes up with this:

They somehow came up with an extra 100m of vertical gain, but since I truly don't know what the actual value is, I can't say that they're any less wrong than I am.
So, now that I have the ability to derive a realistic vertical-climb value, to be honest with myself I must go back and correct prior trips:
Date |
Event |
Vertical Gain Claimed at the Time |
Vertical Gain Realistic Value |
Strava Inflation |
(in feet) |
|---|---|---|---|---|---|
| Jan 24 | My first tentative outing on bike | N/A | 685m | → 2,090' | |
| Feb 7 | My first real mountain ride | 3,850m | 1,517m | 274% | 12,630' → 4,620' |
| March 3 | Kuyataki Waterfall with Manseki | 762m | 540m | 141% | 2,500' → 1,650' |
| March 4 | Group ride southeast of Kyoto | 1,787m | 1,282m | 140% | 5,860' → 3,910' |
| April 16 | “Highly Visible” mountain ride | 1,607m | 1,180m | 136% | 5,270' → 3,600' |
| April 23 | Pleasant 105km lake ride | 1,300m | ? | 4,200' → | |
| April 29 | Coffee at Cowbell | 1,720m | 991m | 174% | 5,600' → 3,020' |
| April 30 | Revisiting my first big mountain ride | 3,159m | 1,609m | 196% | 10,360' → 4,900' |
I didn't have a good barometric-altimeter tracklog for one of the rides.
The amount of “Strava inflation” is shocking. If I could solve this problem for myself in a couple of days, you'd think a real company with presumably smart folks could come up with something.
Anyway, I'll need to find a better app for keeping tracklogs on the iPhone, one that lets me record both the GPS/GLONASS elevation and the barometric elevation, and also my heartrate. As it is now, I'll use a klugy mixture of various devices and combine all the data myself, massage it, smooth it, and then send it to Strava.
If they ever get around to addressing this, I suppose that would be a good time to bring up the next issue: they ignore elevation changes when calculating distance. They correctly note that the difference is perhaps at most 2%, but on a 100km ride that can still be over a mile wrong.
Overall, I guess Strava is just not as anal about statistics as I am...
 photo by Manseki Kanemitsu -- Copyright 2015 Manseki Kanemitsu")
DMC-SZ9 at an effective 26mm — 1/250 sec, f/9, ISO 100 — map & image data — nearby photos
Happy at the Start of a Long Ride
along the Kamo River in Kyoto, Japan
8:51am - taken while moving at 20 kph (12 mph)
photo by Manseki Kanemitsu
If you would have told me half a year ago that I would be riding a bicycle as far as 10km, I would have never believed you. Bicycles where for places too close for a taxi or my scooter or a car.
It's amazing how “giving it a try” can change your opinion about something.
On Thursday I retraced the path I took on my first “real” ride last February, covered in “Attempting a 100km Bikeride in the Mountains of Kyoto, Part 1: Hanase Pass” and then “Part 2: the Last 70km”. The tough part of this ride is not the distance, which turns out to be about 92km (57 miles), but the long unrelenting steep slopes. It was my first real ride because I didn't know any better... it's a pretty tough ride.
So, three months later I have some experience under my belt, I thought I'd try it again. I was happy to be joined by ironman rider Manseki Kanemitsu, whom I met two months ago in “A Bicycle Ride to the Kuuya-taki Waterfall”.
This tough 90+km ride on Thursday followed a ride the previous day that, though shorter and with less hills, was nevertheless pretty intense. So doing this longer/tougher ride the next very next day felt all the more of an accomplishment.
 photo by Manseki Kanemitsu -- Kyoto, Japan -- Copyright 2015 Manseki Kanemitsu")
DMC-SZ9 at an effective 26mm — 1/250 sec, f/9, ISO 100 — map & image data — nearby photos
A Beautiful Day in Kyoto
8:53am - taken while moving at 16 kph (10 mph)
photo by Manseki Kanemitsu
I brought along my Nikon D700, which is smaller than my regular Nikon D4, and a Sigma 35mm f/1.4 lens, but had them packed in the rear bag at first. I had to pull them out when we stopped to pick up some drinks...

Nikon D700 + Sigma 35mm F1.4 DG HSM — 1/8000 sec, f/2.8, ISO 200 — map & image data — nearby photos
Always Stylish
Manseki has a coffee before we hit the mountains
9:09am
The route we took (here), like the first time (here), took us up to the same Hanase Pass that I'd done the previous day, so this made my fourth ascent. I had the camera with me, but left it in the rear pack, so concentrated on the tough climb.
The previous day my main goal had been “don't quit”, and the secondary goal “don't stop”. I felt good today when I realized that “don't quit” was now a given and that “don't stop” had become my primary goal.
I was pleased when I returned home to check the stats... I made the main climb (from Kurama Hot Springs to the pass) in 36:50, beating the previous day's record by almost two minutes, and the first time by more than 10 minutes:
New Personal Best!
After descending the other side, I stopped at a vending machine in the next village to get something to drink, the first of about seven half-liter bottles I ended up buying along the way. And it wasn't even hot (it was about 23°C/73°F).

Nikon D700 + Sigma 35mm F1.4 DG HSM — 1/8000 sec, f/2.8, ISO 200 — map & image data — nearby photos
Small Village
with the sign for the coffee shop Cowbell
10:41am
The coffee shop that I'd stopped at yesterday was closed, so we continued north.
The farther north we moved, the more the cherry blossoms were still out. We came across a tree with blossoms the same color as Manseki's shirt, so I had to pull the camera out again...

Nikon D700 + Sigma 35mm F1.4 DG HSM — 1/6400 sec, f/2.8, ISO 250 — map & image data — nearby photos
Matching
11:00am


 -- Kyoto, Japan -- Copyright 2015 Jeffrey Friedl, https://regex.info/blog/")
Nikon D700 + Sigma 35mm F1.4 DG HSM — 1/5000 sec, f/3.5, ISO 250 — map & image data — nearby photos
Pretty Countryside
11:23am - taken while moving at 25 kph (15 mph)
It was an absolutely-beautiful day in a beautiful countryside, though the photos don't get it across well.
 -- Kyoto, Japan -- Copyright 2015 Jeffrey Friedl, https://regex.info/blog/")
Nikon D700 + Sigma 35mm F1.4 DG HSM — 1/800 sec, f/6.3, ISO 250 — map & image data — nearby photos
11:27am - taken while moving at 16 kph (10 mph)
 -- Kyoto, Japan -- Copyright 2015 Jeffrey Friedl, https://regex.info/blog/")
Nikon D700 + Sigma 35mm F1.4 DG HSM — 1/1600 sec, f/6.3, ISO 250 — map & image data — nearby photos
Preparation for Planting
11:28am - taken while moving at 23 kph (14 mph)
The small valleys we rode through were filled with small family farming plots, many busy with activity in preparation for the next rice crop.
 -- Kyoto, Japan -- Copyright 2015 Jeffrey Friedl, https://regex.info/blog/")
Nikon D700 + Sigma 35mm F1.4 DG HSM — 1/1000 sec, f/6.3, ISO 250 — map & image data — nearby photos
House in the Countryside
11:29am - taken while moving at 24 kph (15 mph)
 -- Kyoto, Japan -- Copyright 2015 Jeffrey Friedl, https://regex.info/blog/")
Nikon D700 + Sigma 35mm F1.4 DG HSM — 1/1600 sec, f/6.3, ISO 250 — map & image data — nearby photos
11:30am - taken while moving at 24 kph (15 mph)
 -- 杓子屋(バス) -- Kyoto, Japan -- Copyright 2015 Jeffrey Friedl, https://regex.info/blog/")
Nikon D700 + Sigma 35mm F1.4 DG HSM — 1/2500 sec, f/5.6, ISO 250 — map & image data — nearby photos
11:32am - taken while moving at 18 kph (11 mph)
 -- Kyoto, Japan -- Copyright 2015 Jeffrey Friedl, https://regex.info/blog/")
Nikon D700 + Sigma 35mm F1.4 DG HSM — 1/400 sec, f/9, ISO 250 — map & image data — nearby photos
Friendly Chat
Manseki chats with an old lady at the river in front of her house
11:39am - taken while moving at 20 kph (13 mph)
 -- Kyoto, Japan -- Copyright 2015 Jeffrey Friedl, https://regex.info/blog/")
Nikon D700 + Sigma 35mm F1.4 DG HSM — 1/1600 sec, f/7.1, ISO 250 — map & image data — nearby photos
11:44am - taken while moving at 11 kph (7 mph)
 -- Kyoto, Japan -- Copyright 2015 Jeffrey Friedl, https://regex.info/blog/")
Nikon D700 + Sigma 35mm F1.4 DG HSM — 1/250 sec, f/7.1, ISO 280 — map & image data — nearby photos
11:46am - taken while moving at 40 kph (25 mph)
 photo by Manseki Kanemitsu -- Kyoto, Japan -- Copyright 2015 Manseki Kanemitsu")
DMC-SZ9 at an effective 26mm — 1/250 sec, f/3.1, ISO 250 — map & image data — nearby photos
Heading Up to Nomi Pass
11:50am - taken while moving at 21 kph (13 mph)
photo by Manseki Kanemitsu
 -- Kyoto, Japan -- Copyright 2015 Jeffrey Friedl, https://regex.info/blog/")
Nikon D700 + Sigma 35mm F1.4 DG HSM — 1/800 sec, f/4.5, ISO 250 — map & image data — nearby photos
11:51am - taken while moving at 21 kph (13 mph)
の到着 -- Kyoto, Japan -- Copyright 2015 Jeffrey Friedl, https://regex.info/blog/")
Nikon D700 + Sigma 35mm F1.4 DG HSM — 1/2000 sec, f/3.5, ISO 250 — map & image data — nearby photos
Gutting It Out
12:01pm - arriving at Nomi Pass, elevation 653m
能見峠 (標高653m)の到着
Less snow this time, unlike last time.
This climb is intensely steep for a short distance, but overall much shorter/easier than I remember from the February trip. Still, I was tired.

DMC-SZ9 at an effective 26mm — 1/1250 sec, f/3.1, ISO 200 — map & image data — nearby photos
Wasted
photo by Manseki Kanemitsu
For the last few years I've not really needed to eat much during the day, and will often have nothing to eat until evening, even on days that I do heavy exercise at the gym. But today I was really tired, in the “drained of energy” sense. In preparation for the trip I'd had breakfast, which I seldom do these days, so that I'd have energy, but by this point I was just weary.
So, we paused a bit for the snacks we'd brought...

DMC-SZ9 at an effective 26mm — 1/200 sec, f/3.1, ISO 100 — map & image data — nearby photos
My Lunch
a natto rice roll
photo by Manseki Kanemitsu
After an all-too-short 8-minute break, we headed down the other side of Nomi Pass. It's very steep and even without snow we couldn't go fast. It took eight minutes to travel the 3km, descending 220m through sharp twisty curves, and it the incessant downward pressure on my wrists hurt quite a bit.
 (compare to this photo in February -- Kyoto, Japan -- Copyright 2015 Jeffrey Friedl, https://regex.info/blog/")
Nikon D700 + Sigma 35mm F1.4 DG HSM — 1/3200 sec, f/3.5, ISO 250 — map & image data — nearby photos
Emerging from the Mountain
12:18pm - taken while moving at 26 kph (16 mph)
(compare to this photo in February)
 -- Kyoto, Japan -- Copyright 2015 Jeffrey Friedl, https://regex.info/blog/")
Nikon D700 + Sigma 35mm F1.4 DG HSM — 1/6400 sec, f/3.5, ISO 250 — map & image data — nearby photos
More Pleasant Countryside
12:19pm - taken while moving at 26 kph (16 mph)
 -- Kyoto, Japan -- Copyright 2015 Jeffrey Friedl, https://regex.info/blog/")
Nikon D700 + Sigma 35mm F1.4 DG HSM — 1/3200 sec, f/5, ISO 250 — map & image data — nearby photos
12:19pm - taken while moving at 36 kph (22 mph)
 photo by Manseki Kanemitsu -- Kyoto, Japan -- Copyright 2015 Manseki Kanemitsu")
DMC-SZ9 at an effective 26mm — 1/1000 sec, f/3.1, ISO 160 — map & image data — nearby photos
“Action Shot” of Me
how I take photos while riding on smooth terrain
12:21pm - taken while moving at 16 kph (10 mph)
photo by Manseki Kanemitsu
 -- Kyoto, Japan -- Copyright 2015 Jeffrey Friedl, https://regex.info/blog/")
Nikon D700 + Sigma 35mm F1.4 DG HSM — 1/2500 sec, f/5, ISO 250 — map & image data — nearby photos
12:26pm - taken while moving at 19 kph (12 mph)

DMC-SZ9 at an effective 26mm — 1/1000 sec, f/3.1, ISO 160 — map & image data — nearby photos
Oops
12:30pm - popped my chain, but fixed in a jiff
photo by Manseki Kanemitsu
 a really pleasant ride? 12:34pm - taken while moving at 38 kph (24 mph) -- Kyoto, Japan -- Copyright 2015 Jeffrey Friedl, https://regex.info/blog/")
Nikon D700 + Sigma 35mm F1.4 DG HSM — 1/800 sec, f/5, ISO 250 — map & image data — nearby photos
Did I Mention
that it was (at times) a really pleasant ride?
12:34pm - taken while moving at 38 kph (24 mph)

Nikon D700 + Sigma 35mm F1.4 DG HSM — 1/6400 sec, f/3.5, ISO 250 — map & image data — nearby photos
Pause for a Real Lunch
in the middle of nowhere, though technically still in the same ward of Kyoto City where the trip started!

Nikon D700 + Sigma 35mm F1.4 DG HSM — 1/250 sec, f/3.5, ISO 640 — map & image data — nearby photos
Bon Appétit
at ダイニングcafe いろは
After lunch came my biggest regret, to pack the camera away before continuing. I thought we were close to Route 367, which I recall as nothing more than a means to get home (I've taken it many times by car), so I didn't think there'd be anything photogenic, but it turns out that the next few kilometers before getting there were the most pretty of the trip.
 photo by Manseki Kanemitsu -- Otsu, Shiga, Japan -- Copyright 2015 Manseki Kanemitsu")
DMC-SZ9 at an effective 26mm — 1/250 sec, f/9, ISO 200 — map & image data — nearby photos
About to Arrive to Route 367
1:42pm - taken while moving at 14 kph (9 mph)
photo by Manseki Kanemitsu
Even Route 367 was filled with beautiful scenery that I'd just never noticed from the car, so eventually I had to pull out the camera...
 -- Otsu, Shiga, Japan -- Copyright 2015 Jeffrey Friedl, https://regex.info/blog/")
Nikon D700 + Sigma 35mm F1.4 DG HSM — 1/1600 sec, f/5, ISO 250 — map & image data — nearby photos
Stacked Wood
on the side of Route 367; 1:56pm
 -- 木戸口(バス) -- Otsu, Shiga, Japan -- Copyright 2015 Jeffrey Friedl, https://regex.info/blog/")
Nikon D700 + Sigma 35mm F1.4 DG HSM — 1/500 sec, f/9, ISO 250 — map & image data — nearby photos
Pretty Curves
though still uphill at this point
2:06pm - taken while moving at 26 kph (16 mph)
From where we entered Route 367 to Kyoto City proper has six tunnels, all of which are dangerous on a bicycle when moving from north to south as we were, because all of them are uphill. When moving away from the city, the stretches with tunnels are downhill and you can apparently get enough speed to move with traffic, so don't have to worry (so much) about being creamed from behind.
When I did this route in February, I had no clue about any of this so I blindly (figuratively and almost literally) went through the tunnels, but Manseki's experience and wisdom knew a better way.
Route 367 has likely existed in some form or another for 1,000 years, certainly from before tunnel technology came to Japan, so each modern tunnel bypasses an original section of particularly twisty mountain road that, to some extent, still exists.
 -- Otsu, Shiga, Japan -- Copyright 2015 Jeffrey Friedl, https://regex.info/blog/")
Nikon D700 + Sigma 35mm F1.4 DG HSM — 1/640 sec, f/9, ISO 250 — map & image data — nearby photos
Bypassed Road
2:10pm - taken while moving at 17 kph (11 mph)
The bypassed roads for the two shortest tunnels were impassable due to construction, but since the tunnels were short, we tried to barrel through them quickly, making sure our lights were on. (I keep my rear light on whenever I ride anyway, as a matter of policy.)
 Defy Death 2:18pm - taken while moving at 19 kph (12 mph) -- Otsu, Shiga, Japan -- Copyright 2015 Jeffrey Friedl, https://regex.info/blog/")
Nikon D700 + Sigma 35mm F1.4 DG HSM — 1/640 sec, f/9, ISO 250 — map & image data — nearby photos
About To (Hopefully) Defy Death
2:18pm - taken while moving at 19 kph (12 mph)
Manseki set a blistering (for me) pace in the tunnel because he has a particular aversion to them, having been sent to the hospital after getting rear-ended in one some years back. That's at least better than the cyclist who was killed last week in a tunnel in the countryside south of Tokyo. 🙁

Nikon D700 + Sigma 35mm F1.4 DG HSM — 1/800 sec, f/9, ISO 250 — map & image data — nearby photos
Turnoff
We were able to bypass the 730m-long Hanaore Tunnel by taking a closed road that goes up 100m to Hanaore Pass. The road is not passable by car, but it's still okay by bicycle. We had to lift our bikes over a chain at the beginning and end.

DMC-SZ9 at an effective 28mm — 1/250 sec, f/3.3, ISO 200 — map & image data — nearby photos
Plowing Up
2:30pm - the start of a short but fairly steep climb
photo by Manseki Kanemitsu

Nikon D700 + Sigma 35mm F1.4 DG HSM — 1/250 sec, f/9, ISO 1250 — map & image data — nearby photos
Road of Questionable Condition
2:32pm
 -- Otsu, Shiga, Japan -- Copyright 2015 Jeffrey Friedl, https://regex.info/blog/")
Nikon D700 + Sigma 35mm F1.4 DG HSM — 1/250 sec, f/6.3, ISO 800 — map & image data — nearby photos
Quite Steep
2:35pm - taken while moving at 6 kph (4 mph)
 -- Otsu, Shiga, Japan -- Copyright 2015 Jeffrey Friedl, https://regex.info/blog/")
Nikon D700 + Sigma 35mm F1.4 DG HSM — 1/500 sec, f/6.3, ISO 250 — map & image data — nearby photos
Photo Op at the Top
2:39pm - Hanaore Pass (花折峠)

Nikon D700 + Sigma 35mm F1.4 DG HSM — 1/500 sec, f/5.6, ISO 250 — map & image data — nearby photos
View of Rt 367
2:48pm - after having descended half way back down

Nikon D700 + Sigma 35mm F1.4 DG HSM — 1/250 sec, f/5.6, ISO 500 — map & image data — nearby photos
“Stop”
2:49pm - “Best to get off and walk along this section”
He hadn't noticed the rocks at first, having been hidden beneath the accumulated leaves and such, but the rocks littering the road in this area were of a particularly sharp variety that can easily cause tire punctures, he said.

Nikon D700 + Sigma 35mm F1.4 DG HSM — 1/640 sec, f/2.2, ISO 250 — map & image data — nearby photos
Sharp Rock
He'd been with half a dozen friends the past weekend on a long (150km) ride that also encountered this kind of rock, leading to four flats among the group. My first thought was that I'd ridden on rocks many times without having given it a thought, but when it comes to cycling I'll certainly defer to Manseki's wisdom.
And I'm glad I did, because a minute later he realized that he'd already gotten a puncture before stopping me.

Nikon D700 + Sigma 35mm F1.4 DG HSM — 1/4000 sec, f/2.8, ISO 250 — map & image data — nearby photos
Bubbly Hole
It was a slow leak (he has tubular tires), so he deemed it safe to ride for a while farther, so we continued down carefully.
We eventually came to see why the road was closed:

Nikon D700 + Sigma 35mm F1.4 DG HSM — 1/3200 sec, f/2.8, ISO 250 — map & image data — nearby photos
“Lane Narrows”
Once we made it back to Route 367, we were treated to super-twisty high-speed downhill cutbacks that cover 1.1km to transverse less than 200m of distance. Unlike the first time I took these in February, there was no traffic, so in theory we could really hit them hard, but with his tire situation we took them slower...
 -- Otsu, Shiga, Japan -- Copyright 2015 Jeffrey Friedl, https://regex.info/blog/")
Nikon D700 + Sigma 35mm F1.4 DG HSM — 1/6400 sec, f/2.8, ISO 250 — map & image data — nearby photos
Taking it Easy
2:57pm - taken while moving at 38 kph (23 mph)
After the road straightens out, I stopped to show Manseki the steps to Kyoto's “I Fall” Tower, which he'd not noticed before. My excuse not to climb the 300+ steps this time was that he had cycling shoes with clips on the bottom. Plus, I was tired.
While we were there, I noticed this guy going the other way (up toward those steep curves)...

Nikon D700 + Sigma 35mm F1.4 DG HSM — 1/250 sec, f/3.2, ISO 250 — map & image data — nearby photos
Interesting
3:04pm - interesting that he bothered with a reflective ankle bracelet, but no helmet
Anyway, it was time for Manseki to attend to his slow leak by injecting some sealant in...

Nikon D700 + Sigma 35mm F1.4 DG HSM — 1/1600 sec, f/3.2, ISO 250 — map & image data — nearby photos
Taking the Tire Off

Nikon D700 + Sigma 35mm F1.4 DG HSM — 1/320 sec, f/3.2, ISO 250 — map & image data — nearby photos
Adding Sealant

Nikon D700 + Sigma 35mm F1.4 DG HSM — 1/2500 sec, f/1.6, ISO 250 — map & image data — nearby photos
Replacing the Valve

Nikon D700 + Sigma 35mm F1.4 DG HSM — 1/1250 sec, f/4, ISO 250 — map & image data — nearby photos
Tire Back On
And we were on our way, and in another hour were home.
Back at home, I was tired, but in much better shape than the first time.
Overall it was about 93km, a bit longer than the first time due to going around the tunnels. It took about as long overall because we stopped often this time to rest and photograph and just enjoy ourselves (and repair the occasional tire). All and all it was a great ride.