One “Kyoto Heart Loop” Ride
highlighted among all the cycling I've done this year
私のサイクリング経験の「ヒートマップ」。よく行く所は赤くなる。
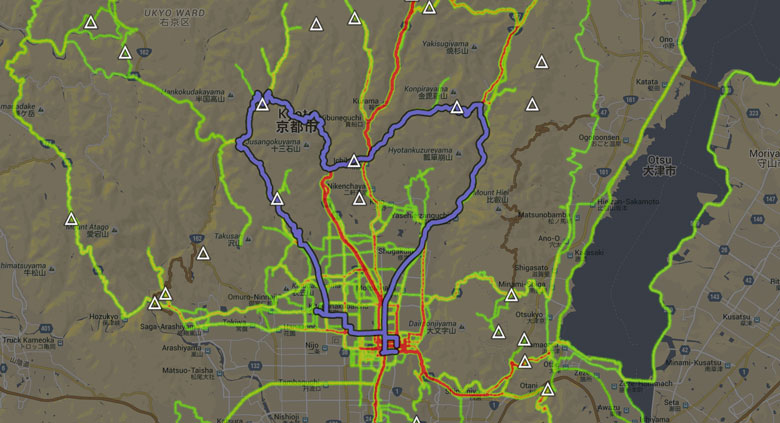
I built a “heatmap” showing all the places I've ridden my bicycle since getting into cycling earlier this year. I thought it might be interesting for visitors researching rides they might want to try.
It's here: “Heatmap of Jeffrey's Cycling in Kyoto”.
At the moment it includes data on 76 rides, with areas of yellow and red being more-often visited roads.
Clicking anywhere I've ridden brings up a list of rides that passed the area...

In the example above, I'd ridden the clicked-on road three times. Clicking then on the most-recent ride name highlights the whole ride on the map, and info about the ride shows up at the top:
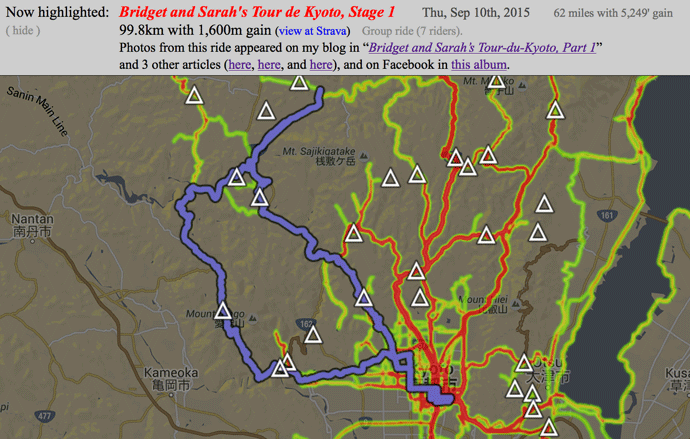
The info at the top includes a link for the activity at Strava, and any related blog posts or Facebook photo albums.
Mountain passes are marked with a triangle icon; clicking on one brings up its name and elevation...
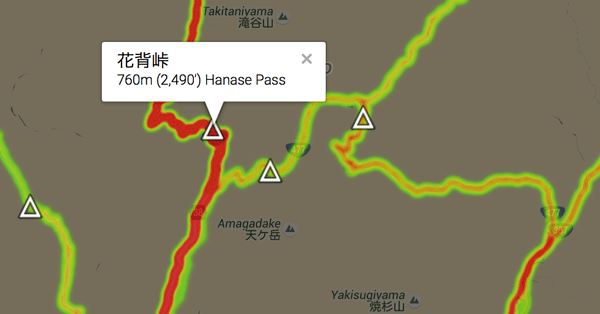
You can turn off the mountain-pass display by clicking on the triangle icon in the upper-right corner of the page.
I don't know whether this will actually be interesting for anyone besides me, but since I made it, I thought I'd share it.
(Thanks to Google for providing the tools that do all the hard work of mapping and display.)
Hi Jeffrey,
I enjoy your blog tremendously, it covers my hobby’s exactly: photography, GPS-tracking, mountainbiking.
Your heatmap looks interesting but I have used a similar tool for some time now:
http://www.jonathanokeeffe.com/strava/map.php
This works for me, maybe for you too.
Greetings from Holland,
Chiel
It looks very nice, and is certainly more useful than what Strava’s provides! Mine is more integrated with my blog, which is great for me, but it doesn’t work with anyone else’s. It’s very nice that you made yours open to anyone. —Jeffrey
Yesterday I was happy because I posted my first photo on Strava. Looks like I will not be able to keep up with the Joneses at this level.
I don’t know, Rick, the tool provided by Chiel in the link above looks pretty cool…. you can make something similar to this, just without built-in links to my blog. 😉 —Jeffrey
I do not understand why Strava is not putting more effort in heatmaps. I know I am interested in where I have been en how often. In fact, I have a contest of sorts with a collegue: who has “collected” the most roads in our area. Which is what Jonathans tools shows much better that the build-in heatmap at Strava.
As you are in analysis as much as I am: have you ever done anything with weather data? I would love to have something like Endomondo. It shows the weather conditions at the start of your trip. In Holland, where I live, wind and rain play have as much effect on your segment times as condition or strength has, so it would be nice if you could somehow do something with this information. Just a thought 🙂
Chiel